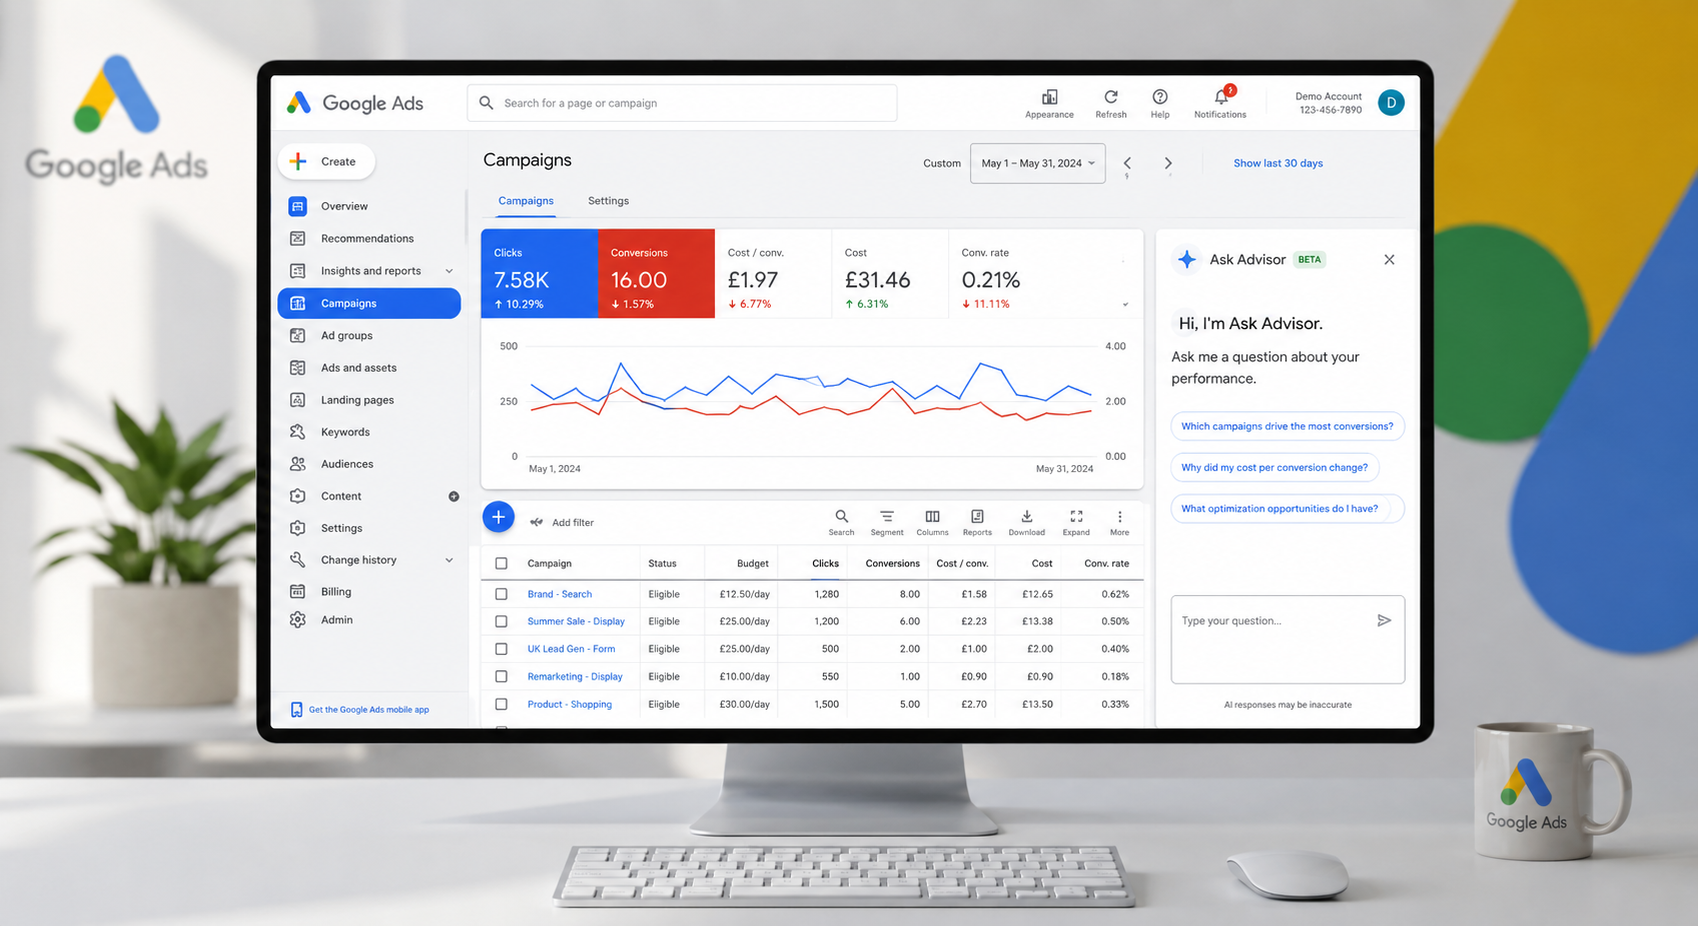
A campaign can report a strong return on ad spend and still leave very little profit after product cost, shipping, discounts and returns. That is why essential ecommerce advertising metrics must do more than make a platform dashboard look healthy. They need to show whether paid media is producing commercially valuable orders, where budget is leaking, and what should be changed next.
For ecommerce operators, the challenge is not a lack of data. Google Ads, Meta and analytics platforms produce more figures than most teams can reasonably act on. The answer is to build a focused reporting view around revenue quality, efficiency and conversion performance, then use it to make measured decisions rather than chase platform recommendations.
Start with the metric that protects profit
ROAS is useful, but only with context
Return on ad spend (ROAS) is the headline metric for most ecommerce advertising. It is calculated as attributed revenue divided by advertising spend. If £1,000 in paid media generates £5,000 in tracked revenue, ROAS is 5.0 or 500%.
That figure is valuable because it quickly reveals how efficiently a campaign generates sales. It also gives teams a common language when comparing Shopping, Performance Max, paid social and remarketing activity. But ROAS is not a profitability metric on its own.
A retailer with a 70% gross margin can support a very different target ROAS from a retailer selling low-margin electronics, heavy products with expensive delivery, or items with frequent returns. If your gross margin is 40%, a 3.0 ROAS may appear acceptable until payment fees, fulfilment, staff costs and returns are included. The result can be sales growth that puts pressure on cash flow.
Set a break-even ROAS before setting campaign targets. A simplified calculation is:
Break-even ROAS = 1 ÷ contribution margin before advertising
If 30% of each sale remains after variable costs, the break-even ROAS is 3.33. In practice, most businesses need performance above that level to contribute towards overheads and profit. This is why a blended or platform-reported ROAS should always be read alongside margin data.
Measure profit-adjusted return where possible
The more mature version of ROAS reporting accounts for the economics of the products being advertised. That could mean sending gross-profit values into ad platforms, segmenting product feeds by margin band, or reporting media performance alongside fulfilment and return data.
It will not always be practical to pass every cost into Google Ads or Meta. Start with the categories that make the biggest difference: high-return products, low-margin lines, sale items and bestsellers. A campaign that sells more of the wrong products is not necessarily a winner.
Essential ecommerce advertising metrics for daily control
Revenue, spend and orders
These are basic measures, but they establish the commercial reality. Revenue tells you the value attributed to advertising, spend shows the cost of generating it, and orders reveal whether revenue movement is being driven by more customers or simply a higher average basket value.
Review them by channel, campaign type and date range. A sudden fall in orders with stable spend can point to a landing-page issue, stock problem, checkout fault or shift in traffic quality. A rise in revenue without a proportional order increase may be welcome, but it can also reflect a promotion or a small number of unusually large purchases.
Do not judge a day in isolation when purchase cycles are longer or weekend behaviour is significant. Compare like-for-like periods and account for promotions, bank holidays and stock availability.
Cost per acquisition and cost per order
Cost per acquisition (CPA), often called cost per order in ecommerce, is ad spend divided by conversions. It answers a simple question: what did it cost to acquire each tracked sale?
CPA is especially helpful where average order values are relatively consistent. It can expose campaigns that are generating volume at an unsustainable cost even when the overall account ROAS looks reasonable. It is also useful for comparing prospecting with remarketing, although the two should not be held to identical targets.
Remarketing normally delivers a lower CPA because it reaches people already familiar with the brand. Prospecting must create new demand and will usually look less efficient in platform attribution. Cutting all higher-CPA prospecting activity can protect short-term figures while weakening future sales volume. Assess its performance over a longer window and against new-customer value where that data is available.
Conversion rate
Conversion rate is the percentage of ad clicks or sessions that result in a purchase. A falling conversion rate is often blamed on campaign targeting, but the source may sit elsewhere: a slow product page, unclear delivery information, weak pricing, unavailable variants or a cumbersome checkout.
Use conversion rate to separate traffic problems from website problems. If click-through rate remains strong but conversion rate drops across several paid channels, investigate the site first. If conversion rate falls only in one campaign, assess audience quality, search terms, creative message and the relevance of the landing page.
Conversion rate should also be split by device. Mobile may deliver the majority of clicks but a weaker purchase rate, while desktop converts strongly at a higher cost per visit. That does not automatically mean reducing mobile investment. It may mean improving mobile page speed, payment options or product-page usability before restricting reach.
Average order value
Average order value (AOV) is revenue divided by orders. It is one of the most overlooked levers in paid ecommerce growth because a modest increase can improve the economics of the entire account without needing cheaper clicks.
Bundling complementary products, threshold-based free delivery and sensible upsell offers can raise AOV. Yet there is a trade-off. Aggressive offers may reduce margin or depress conversion rate. Test them against contribution, not only against a higher basket value.
For advertising analysis, watch whether a campaign produces below-average AOV orders. Broad shopping activity may attract bargain-led customers, while brand search or remarketing can deliver larger baskets. That distinction helps set realistic CPA and ROAS targets by campaign rather than applying one account-wide figure.
The metrics that explain performance changes
Click-through rate and cost per click
Click-through rate (CTR) indicates how compelling and relevant an ad is to the people seeing it. Cost per click (CPC) shows what you are paying to bring visitors to the site. Neither is a business outcome, but both are useful diagnostic measures.
A low CTR in paid social can indicate creative fatigue, poor audience fit or an offer that lacks a clear reason to act. In Google Shopping and Performance Max, rising CPC may reflect more competition, a feed issue, changing product mix or the system moving towards more expensive auction opportunities.
Avoid optimising for the cheapest possible click. Cheap traffic that does not convert is wasted budget. Equally, a high CPC is not automatically a problem if the traffic produces profitable orders. The relationship between CPC, conversion rate and AOV is what matters.
Impression share and lost opportunity
For eligible Google Search and Shopping activity, impression share can help identify whether a profitable campaign is constrained by budget or ad rank. If a high-margin product group is consistently profitable but loses substantial impression share because of budget, additional spend may be justified.
However, impression share is not an instruction to spend more. Scaling only makes sense when inventory is available, tracking is reliable, marginal ROAS remains viable and the business can fulfil extra demand. More exposure for a weak offer simply creates more expensive evidence that it needs work.
New customers, repeat purchases and payback
A first order does not always tell the full story. Brands with strong repeat purchase behaviour can afford a higher first-order CPA than businesses reliant on one-off sales. Track new versus returning customers where your analytics setup allows it, then estimate whether acquisition cost is repaid over a sensible timeframe.
This is particularly relevant for subscription products, consumables and replenishable ranges. Paid social may appear weaker than branded search on immediate ROAS, yet contribute more new customers who return several times. Attribution will never be perfect, but customer cohort data provides a more grounded view than judging every channel solely by last-click revenue.
Build a reporting rhythm people can act on
A useful dashboard should answer three questions: Are we profitable enough? What changed? What action follows? If it cannot answer the third, it is reporting rather than management.
Track daily spend, revenue, orders, CPA and ROAS to spot urgent problems. Review weekly trends in conversion rate, AOV, CPC, CTR, product performance and search demand. Then use monthly reporting for margin, new-customer contribution, repeat purchase behaviour and budget allocation decisions.
Data quality deserves the same attention as campaign settings. Check that purchase values include the correct currency and tax treatment, duplicate transactions are excluded, consent settings are understood, and key platforms are using the same conversion definition wherever possible. Server-side tracking and enhanced conversions can improve signal quality, but they do not remove the need for commercial judgement.
Do not let automated bidding set the agenda
Google and Meta bidding systems can process more auction signals than any manual team. They are valuable tools when conversion tracking is accurate, targets reflect real economics and campaigns have enough clean data. They are less reliable when fed inflated revenue, incorrect conversion values or targets that ignore margin.
Treat automated recommendations as hypotheses, not instructions. A suggestion to raise a target CPA or lower a ROAS target may unlock more volume, but it may also direct spend towards less profitable orders. Test material changes carefully, record the expected outcome and judge results over a meaningful period.
The strongest ecommerce advertising accounts pair automation with hands-on oversight: product feed management, creative testing, audience strategy, landing-page improvements and disciplined budget control. That is how paid media becomes accountable growth rather than a monthly cost line.
If your reporting cannot clearly connect ad spend to profitable sales, start by fixing the measurement before increasing the budget. A focused audit of tracking, product economics and campaign structure often reveals the fastest route to more reliable growth.